
Data-Driven Development of Buyer Personas
Product Owners
Front-End Developers
Process Designer
Sales Development Representatives
Sales Manager
Digital Marketing Leader
User Research: Conduct research methods and analyze user data.
UX Designer: Moderate workshops, create buyer personas, and user archetypes.

Context of the challenge
Understanding the users of a product or service is both a challenge and a crucial factor in enabling companies to make informed decisions that add value to their audience and drive business growth.
One day, I had the opportunity to take on the challenge of identifying the buyer personas among Bancolombia employees and uncovering their key life moments that influence insurance purchasing decisions.
To tackle this challenge, I established the following strategic work plan
It was neither linear nor static, but it provided structure and methodology to guide our process
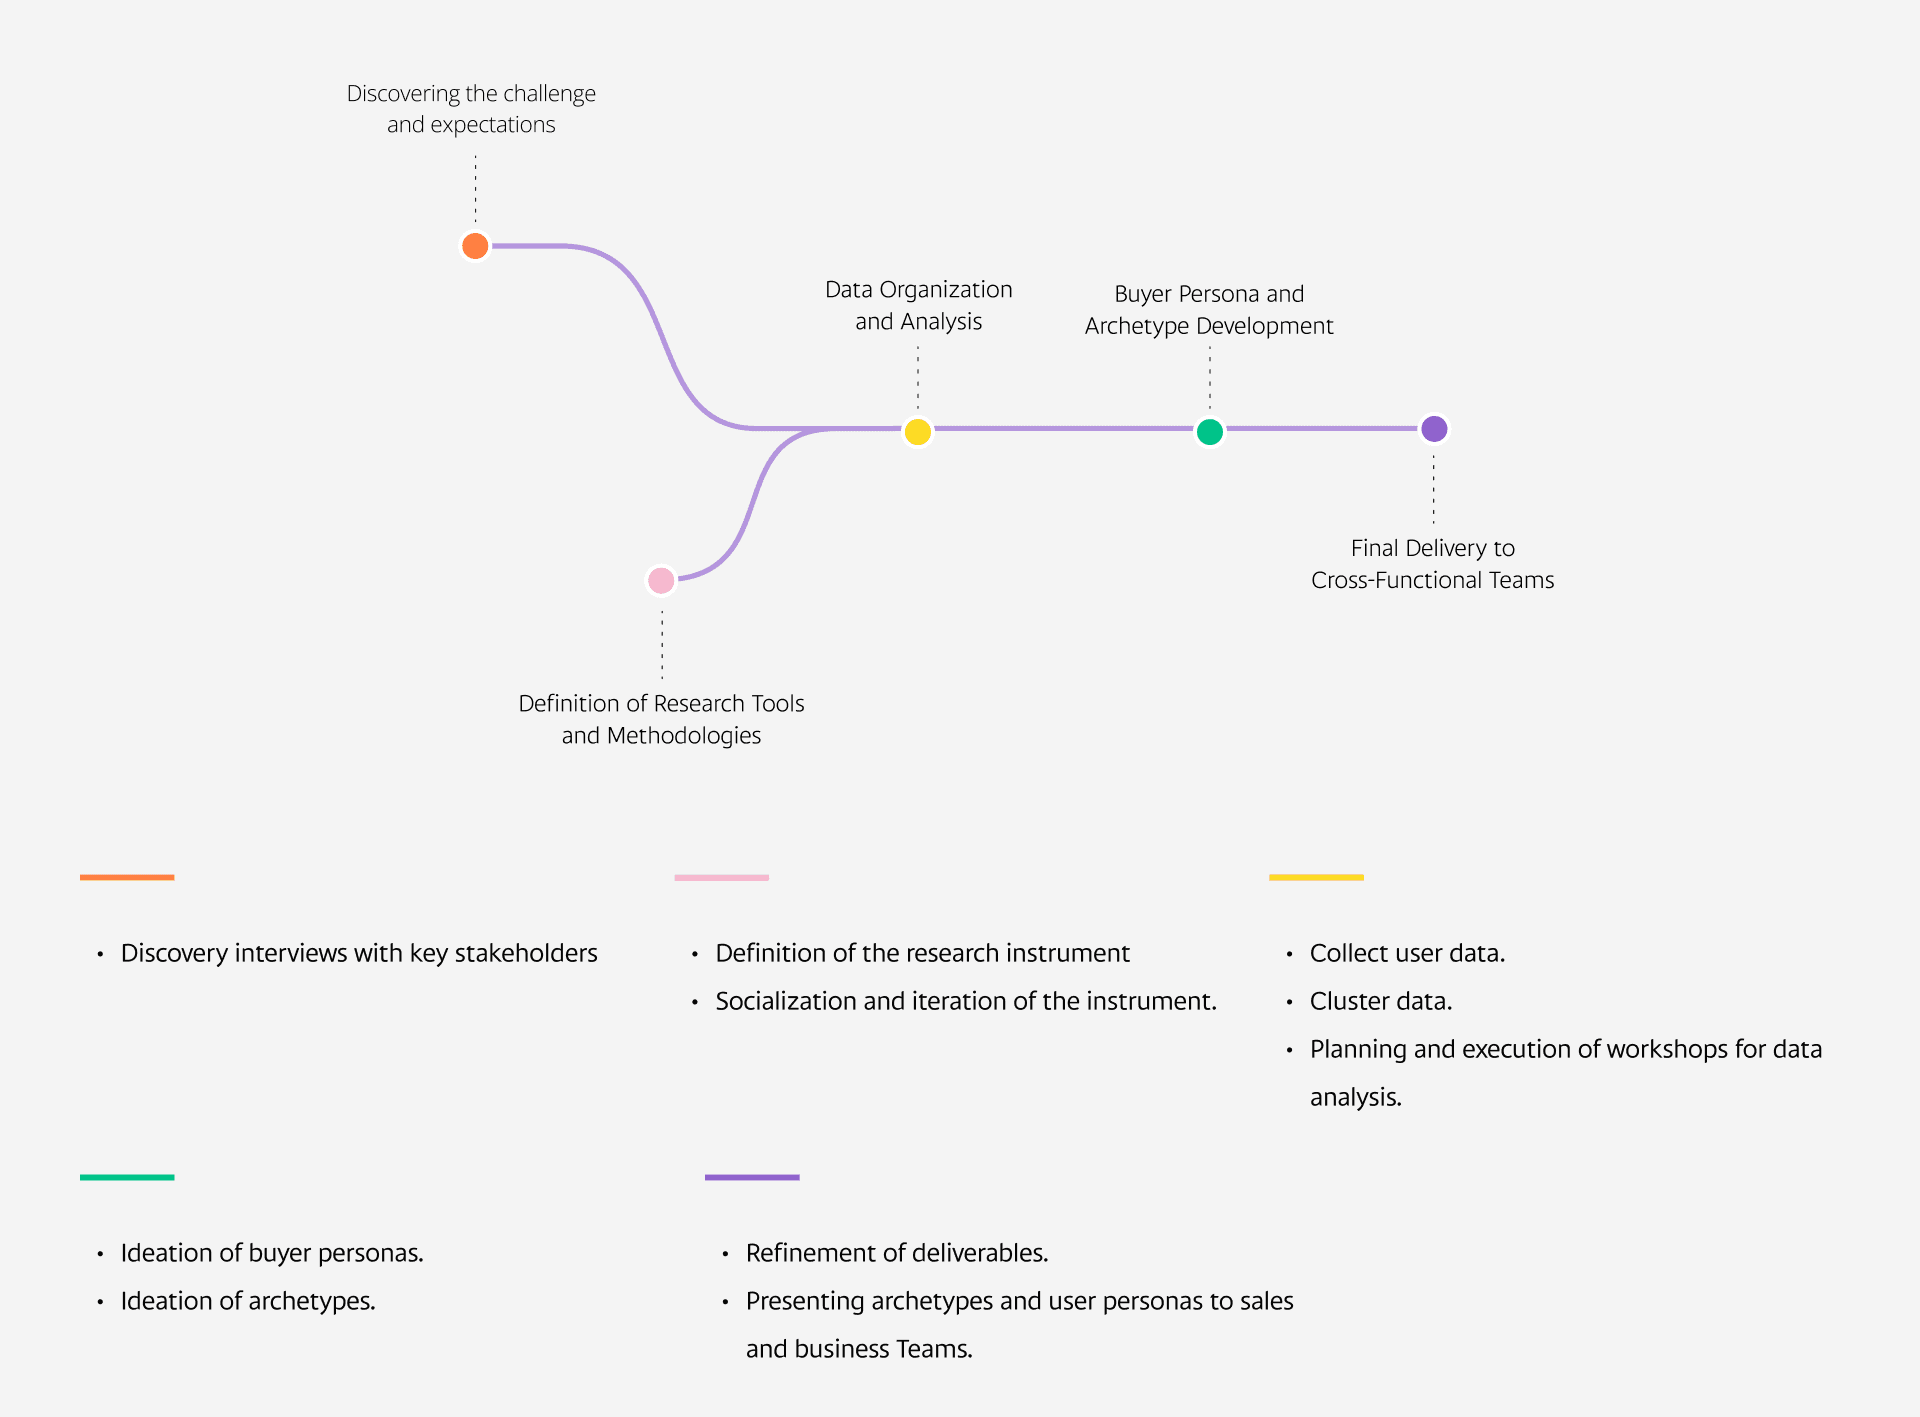
Discovery of the challenge and expectations
Interview with stakeholders
The initial step was to understand the expectations of the process team, sales team and the Product Owner, who emphasized the importance of empathizing with employees to ensure decisions aligned with their needs. This alignment was crucial for developing a strategic approach and effective actions that enhance the value of processes, marketing and sales efforts, and the overall insurance purchasing experience.

Choice of type of research
Given the priority of the project and the intention to add value from the UX in an agile manner, I chose the survey, as it was a quick way to obtain a large amount of data to make strategic decisions.
Furthermore, at the bank, we already had some demographic data of the users to find a correlation between this data and future results to analyze, draw conclusions, and identify common patterns.

Definition of the research instrument
Construction of the survey
I began to devise questions that addressed each proposed objective, starting with more demographic questions to gain a deeper understanding of our employees.
Afterwards, I set aside a space with people from the team to review the questions, with the hope that everyone agreed and felt comfortable with the survey questions.
After that, I started building the survey in the survey software. When the survey was finished, we disseminated it with the database of our employees, of whom we already had demographic data and in less than 2 days we already had more than 1,000 surveys answered.

Order compiled data
With the qualitative data, the first thing I did was create a cluster with each open question. Then, under each of these, I created several groups of answers, grouping them with those that coincided so that I could analyze them by theme and more easily identify the insights.
In the case of closed questions with quantitative results, create an Analytics dashboard to be able to cross-check and filter all the responses according to the identified segments, since the program where we did the surveys delivers reports for each loose response. To do this, we combined all this data in a Google Sheets and integrated it into Looker Studio.
Due to security and confidentiality policies, not all the information and details of the project were exposed in this case study that you will read.

Analysis methodology
To analyze all this data, plan two 2-hour workshop-type spaces with the interdisciplinary team stakeholders (Operations, Sales, and Experience Design) in order to analyze the data from various points of view.
Workshop 1:
In this first session, we looked at demographic questions. For this, I proposed using the 'How Might We?' method to explore how we might add more value for our clients using this data.
Workshop 2:
The objective of this workshop was to identify the correlations and distinctions between the marital statuses of the respondents with respect to the intention to purchase insurance. For this, the following dynamic was proposed:
Filter the dashboard by marital status.
Analyze the data for each question.
Obtain observations and points of view regarding business opportunities and improvement of the experience.
See business opportunities to provide more value to users from each of our roles and disciplines.
Socialize points of view to conclude.
Due to security and confidentiality policies, not all the information and details of the project were exposed in this case study that you will read.

Build buyer personas and archetypes
After analyzing this data as a team. I took all the conclusions from the workshops to convert all this into people and archetypes:
To do this, I began to analyze the conclusions and data by the marital status of each of the respondents, crossing it with the open answers to summarize it in people to whom I assigned names and roles.

Adapting the user persona template to the project's aims
Based on the project objectives and analysis, we developed the following quadrants for the user persona:

Analysis matrix
After building the buyer personas, I built two matrices to be able to synthesize a lot of information that will help those involved in the project make decisions:
Content and channel matrix:
The objective was to equip the marketing and sales teams with the most effective communication strategies for each identified segment, including tailored digital assets and actionable examples to guide implementation.
Business Matrix:
The objective was to inform stakeholders about emerging business opportunities, identify insurance segments with higher purchase intent, and ensure no segment was overlooked, ultimately enabling a more efficient and targeted strategic approach.
Due to security and confidentiality policies, not all the information and details of the project were exposed in this case study that you will read.

Big data and surveys are powerful agile tools for identifying user behavior patterns through statistical probabilities, offering greater confidence in decision-making—particularly in areas where traditional quantitative data may fall short.
One of the most effective ways to analyze big data is by involving cross-functional teams. This approach not only supports informed decision-making but also reinforces the strategic value of research, helping teams internalize insights and uncover high-impact opportunities.
Big data is often analyzed at a surface level—like observing only the tip of the iceberg. However, true insight lies beneath. Diving deeper into the data is where real analysis begins, and it’s a crucial skill every product designer should refine to drive more informed and impactful design decisions.